A 24 GB 3090 serves a 125B MoE at 111 tok/s, and the engine's own calibrator overstates that by 17%
Status: smoke-tested, N=1. Strata 0.1.39 serving Qwen3.8-Flash-Next GSQ-RCO
Q2_0 at a 32,768-token context on one RTX 3090 sustains 111.28 generated
tokens/s over a 1,916-token answer to a 30,341-token prompt — inside the
upstream README's claimed 100–140 tok/s band for this card, sitting near its
floor. The same run's built-in calibrator predicts 130.1 tok/s for the
settings it chooses, which the real long-context request does not deliver.
The question
Strata is a GGML-family inference engine that runs Qwen3.8-Flash-Next — a 125B-parameter, 24,576-expert MoE with 10 experts active per token — on a single consumer GPU, serving OpenAI- and Anthropic-compatible APIs on localhost. Its README extrapolates a number for a card this lab owns exactly one of:
an RTX 3090 (24 GB) should write about 100–140 tokens per second
That is a claim about our hardware class, and the lab's only published
measured rows are from other cards: an RTX 5070 12 GB at 53 tok/s on IQ3_S
and 94 tok/s on Q2_0. The question is whether a 3090 on this bench lands in
the claimed band.
A second question rides along, because the engine ships a --calibrate mode
that micro-benchmarks tuning constants on the host and writes its picks to the
model config. Whether that calibration's own numbers predict serving throughput
is a separate, testable claim — and it is the one that turns out to be
interesting.
Method
One arm, one model, one quant, one context length, N=1. This is a smoke test with an eyeball exit, not a controlled comparison: nothing here is matched against a baseline arm, and no second factor varies.
The quant is Q2_0, and that is forced. Q2_0 is the 100–140 band — the
README's 3090 row traces to an "Other GPUs (estimated)" table whose 3090 entries
read ~130 tok/s at 32K for Q2_0, ~103 for IQ2_XS, ~89 for IQ3_XXS.
IQ3_S has no 3090 row at all, so measuring it would test a claim nobody made.
Q2_0 is also the only size that fits: the host has 62 GiB of RAM with ~17 GiB
already resident, and Q2_0 asks ~34 GB of experts plus ~6 GB where IQ3_XXS
asks ~43 + ~6.
"Does it fit in 24 GB" is the wrong gate. It never fits in 24 GB and is not
meant to. VRAM holds a hot expert cache; system RAM holds all the experts; the
CPU computes whatever the GPU did not cache. More VRAM buys speed, not
feasibility. The real gate is five host checks — VRAM ≥ 12 GB, ~40 GB RAM
resident, ~70–80 GB disk, driver ≥ 580, AVX2 — plus a MemAvailable preflight
that runs immediately before the GPU lock is taken, so an under-provisioned host
fails loudly instead of feeding the OOM killer while holding the card.
The host. tower: RTX 3090 24 GB (compute 8.6, driver 595.91.07), AMD
Ryzen 7 3700X — Zen 2, DDR4, 16 threads, AVX2 but no AVX-512 — 62.7 GiB
RAM, NVMe. The engine is pinned to upstream tag v0.1.39, commit 6f32ec0,
re-asserted against the resolved sha before the build proceeds so a retagged
upstream release is a red build rather than a silently different engine.
The run is a real serving request, not a benchmark harness. The engine
starts under a GPU lock, the pipeline proves /health, /v1/status and
/v1/models, then POSTs a streaming /v1/chat/completions. The prompt is
97,552 characters of upstream documentation with a question appended — "write a
detailed technical summary of how this engine divides work between the GPU and
system RAM … at least 400 words of continuous prose" — fitted to 30,341 tokens
by asking the server itself to count, in three shrinking rounds, because the
server exposes no tokenize endpoint and never truncates a request.
Settings are whatever --calibrate picks, run once on this host before the
measured request: --expert-cache auto --prefill auto --spec 4 --max-context 32768 --kv int8, plus the calibrator's own --pcie-frac 0.00 and
--spec-min-p 0.70. Running upstream's tuning constants, measured on a
different CPU, is thereby removed from the list of explanations for any result.
The measured quantity is sustained generation rate: completion tokens divided by the wall-clock seconds from the first streamed token to the last, over a single answer.
The null is the claim's own band. There is no instrument floor to establish here because the measurement is a clock against a token counter, not a similarity metric: the thing the number is read against is the 100–140 tok/s interval upstream published for this card, in the same units and at the same 32K context.
The decision rule, fixed before the run:
| Outcome | Condition |
|---|---|
| PASS | Engine loads, HTTP 200, correctness assertion holds, and generation ≥ 100 tok/s. |
| SERVES BUT SLOW | All of the above except generation < 100 tok/s. A finding, reported with the confound below — not a red build. |
| FAIL | Engine will not load, OOM-kill, watchdog stall, or no correct answer. |
100 is the bottom of the band and also upstream's own Q2_0 figure at 128K —
the most forgiving reading of the claim.
The correctness assertion is what a 2-bit quant cannot fluke and a human can
eyeball in the log: finish_reason == "stop" (not length, not an error),
completion_tokens >= 256, and a non-empty answer distinct from the reasoning
trace. Exact string equality is deliberately not asserted — upstream documents
that the same prompt at temperature 0 can end in a different equally good
answer, because how many tokens share an expert depends on the speculative
decoding window and the server carries its prompt cache across requests.
The confound, named before the numbers. Upstream labels the 3090 row "Not
measured — estimated from the runs above (same CPU and 64 GB RAM) … Treat as
±20%". The basis machine is a Ryzen 5 7600 with DDR5; its tuning defaults were
measured on that CPU paired with an RTX 5070. tower is Zen 2 with DDR4 and no
AVX-512, and every expert not resident in VRAM is computed by that CPU. So the
asymmetry is built in: a result inside the band confirms the claim on this
hardware cleanly, while a result below the band would not cleanly falsify the
engine, because CPU and memory bandwidth are uncontrolled.
Results
| Quantity | Measured | Reference |
|---|---|---|
| Sustained generation | 111.28 tok/s | README band 100–140; upstream's 3090 Q2_0 @32K estimate ~130 |
| Engine's own counter | 111.1 tok/s | — |
| Expert-cache hit rate | 97.3% | 85.8–86.3% during the short prompt-fit probes |
| Prompt | 30,341 tokens (97,552 chars, 3.21 chars/tok) | context limit 32,768 |
| Completion | 1,916 of max 2,048 tokens, stop |
assertion needs ≥ 256 |
| Answer / reasoning split | 6,930 chars answer, 1,612 chars reasoning | assertion needs a non-empty answer |
| GPU expert cache | 13,465 experts, 17.34 GiB | — |
| VRAM in use | 24,095 / 24,576 MiB (98%) | — |
| Experts locked in RAM | 31.64 GiB of ~38 GB loaded | 62.7 GiB host total |
| Calibrator's prediction | 130.1 tok/s | its own pick, same host, same settings |
Verdict: PASS. All three correctness conditions hold and 111.28 ≥ 100.
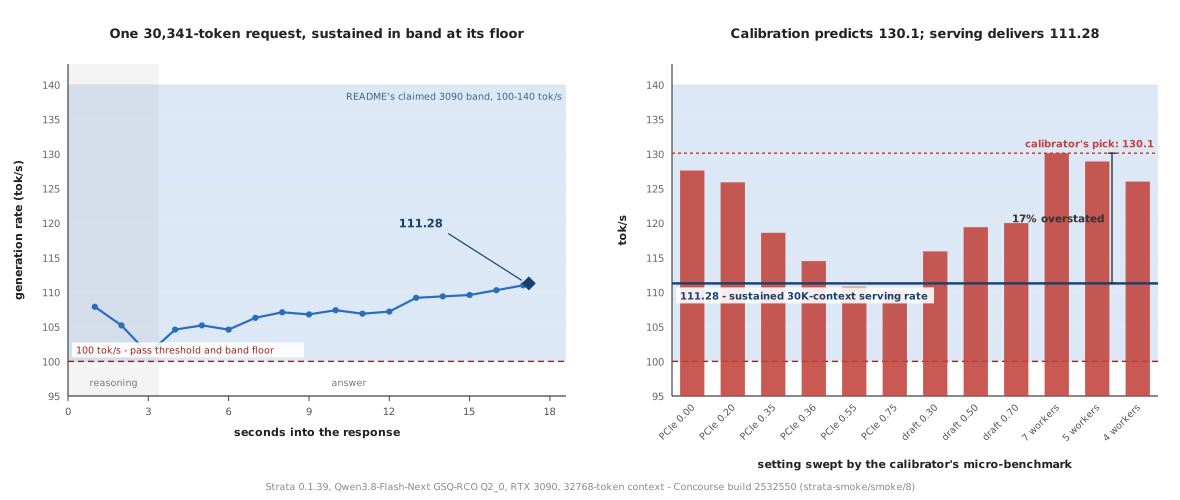
The left panel is the check on the headline. The rate never collapses and never spikes: it dips to 101.1 tok/s as the model finishes reasoning, then rises monotonically through the answer to 111.0. A number that holds for seventeen seconds across 1,916 tokens is a sustained rate, not a burst.
Three builds measured the same configuration on the same host: 110.72, 110.53 and 111.28 tok/s. The spread is 0.75 tok/s, under 0.7%. The engine is repeatable here even though the experiment is not replicated in the statistical sense.
The calibrator overstates sustained throughput by 17%. The right panel is
the finding nobody asked for. --calibrate restarts the engine for each
setting, measures a short generation, and reports: PCIe share 0.00 → 127.6,
0.20 → 125.9, 0.35 → 118.6, 0.36 → 114.5, 0.55 → 110.8, 0.75 → 110.3; draft
floor 0.30 → 115.9, 0.50 → 119.4, 0.70 → 120.0; CPU workers 7 → 130.1,
5 → 128.9, 4 → 126.0. It concludes [ok] tuned for this PC: --pcie-frac 0.00, --spec-min-p 0.70 (130.1 tok/s). Nineteen minutes later the engine it tuned,
at exactly those settings, serves a 30K-token request at 111.28 — 85.5% of
the predicted figure.
That gap has an obvious candidate cause and this design cannot test it: the calibration probes generate from a short prompt, where the KV cache is small and the resident expert set stays hot, while the measured request carries 30,341 tokens of context. Whatever the mechanism, the operational consequence is concrete — the number the calibrator prints is not a throughput forecast for long-context serving, and a reader who sizes work against it will be ~17% optimistic.
What it means, and who was right
Upstream was right about the 3090, and conservative in the right direction. Its own documentation flags that row as estimated and asks to be read at ±20%; the measured result lands inside the band it published, at 111.28 against a ~130 point estimate — 15% below the midpoint, comfortably inside the stated tolerance, on a CPU markedly worse than the one the estimate was built from. An extrapolation that survives a transplant to Zen 2 and DDR4 with no AVX-512 was an honest extrapolation.
The practical reading: a single 24 GB consumer card plus 62 GB of system RAM serves a 125B-parameter MoE at a rate that outpaces reading speed, at a 32K context, through an OpenAI-compatible endpoint. The constraint that bites is not the GPU but the host — 38 GB of experts have to live in RAM, and the card runs at 98% of its VRAM to hold 13,465 of them hot.
The calibrator is the thing to distrust. It is still worth running — it removes someone else's tuning constants from the explanation list, and the settings it picks are the settings that produced 111.28 — but its headline number describes its own micro-benchmark, not the workload.
What this does not settle
- N=1, one prompt, one quant, one context length. One 30,341-token document
with one question appended, at
Q2_0, at 32,768 tokens. Three builds agreeing to within 0.7% show the engine is repeatable at this configuration; they say nothing aboutIQ2_XS, about 128K context, or about a prompt whose expert distribution differs from upstream's own documentation. - Nothing about prefill. Time-to-first-token reads 0.16 s, and that number
is not a prefill measurement: the prompt-fitting probes had already sent this
exact prompt, so the engine answered from a warm KV cache (
cached_tokens30,336 of 30,341). No prompt-processing rate is reported here, and the upstream prompt-throughput claims are untested by this run. A clean prefill number needs a cold cache and a prompt the server has not seen. - The in-band result confirms the claim only at the floor. 111.28 sits in the bottom quarter of 100–140. It establishes that this hardware reaches the band; it says nothing about whether a better-matched host reaches the top of it, and it cannot separate "the engine is this fast" from "this CPU is this slow".
- The 17% calibration gap is one observation of one gap. Context length is the obvious suspect and is untested: proving it needs the same engine measured at several prompt lengths against the same calibration run. Until then the honest statement is that calibration's figure and serving's figure disagree on this host by that amount, not that long context is the cause.
- Correctness was eyeballed, not asserted against a known answer. The
implemented check is structural —
finish_reason == "stop", ≥ 256 completion tokens, a non-empty answer — plus a human reading the output. A required literal was specified and not implemented, so nothing here mechanically verifies that a 2-bit quant answered correctly rather than fluently. The 6,930-character answer is coherent, on-topic and grounded in the supplied document; that is a judgement, not a test. - Nothing about the engine as an agent backend. Serving one streaming
completion is not the same as driving a tool-calling agent loop. Structured
output is advertised as
prompt_and_validatewithconstrained_decoding: false, which is a materially different guarantee, and it is untested here. - Single-user, single-request.
concurrency: {serving: 1, requested: 1}. No measurement of what two simultaneous requests do to either the rate or the expert cache hit rate.
Cost
Compute to output. 17.209 s of generation for a 1,916-token answer — roughly 1,100 words, or about three pages, in seventeen seconds. That is several times faster than a person reads. The honest cost is the startup, not the generation: the engine takes 4m25s from launch to a serving
/health, of which ~4m20s is loading 31.64 GiB of experts into locked RAM at ~1.9 GiB/s. Add--calibrateand it is 19 minutes before the first token, because calibration restarts the whole engine once per CPU-worker setting and pays that four-minute load each time.Peak memory. 24,095 MiB of 24,576 — 98% of the card — with 13,465 experts (17.34 GiB) pinned in the GPU expert cache. Host RAM reads 44.2 GiB of 62.7 GiB in use at the moment the engine reports ready. Per-process peak RSS is not instrumented; the host figure is a point sample from
/v1/status, not a peak.Calendar time from the ask: about 19 hours. The question was raised at 12:12 PDT on 2026-10-04 and this report was published the following morning. The active build span is 10h45m — first pipeline build at 12:33 PDT, the measuring build finishing at 23:18 PDT — of which the successful build itself is 1h07m30s. Most of that hour is not the measurement: compiling the engine for
sm_86only, downloading 66 GB of weights, and building the expert pack all happen outside the GPU lock, deliberately, because holding the lab's single 3090 through a 66 GB download would block every render on the box.Failed and abandoned builds: five, before the three that agreed.
- #1, 12 s — the pin check compared a tag to a sha. Under
tag_filterthe git resource writes the tag name into.git/ref, not the commit, sov0.1.39"did not resolve" to6f32ec0. The check was right to be loud; it was reading the wrong file. - #2, 42m17s — the engine's
strata-q2_0.jsonpointed at GGUF paths from a previous build's ephemeral workspace: "refers to missing files … run it again with--setupto repair". A config written in one container and read in another is a container-lifetime bug, not a model bug. - #3, 1h08m54s — an unhandled
HTTP 400from the server. The prompt overran the 32,768-token context, and this engine never truncates: it rejects. The three-round server-counted prompt fitter exists because of this build. - #4, 1h07m45s — "the server streamed no content at all". The model
spent its entire 2,048-token budget reasoning and emitted no answer. Fixed
by sending an explicit
reasoning_budget_tokensso the thinking phase leaves room to speak. - #7, 59m52s, SIGTERM at 19:15 PDT — killed by hand, mid-
--calibrate. Calibration restarts the engine for every setting it sweeps, and each restart locks ~32 GiB of RAM on a workstation someone was using. This is a reproducible hazard, not bad luck: do not run--calibrateon an occupied box. Calibrate once, record the picks, and pass them as flags thereafter.
Builds #5 (1h04m18s) and #6 (1h05m41s) succeeded and produced 110.72 and 110.53 tok/s; #8 (1h07m30s) is the run reported here.
- #1, 12 s — the pin check compared a tag to a sha. Under
Files
Scripts are plain Python and a Concourse pipeline; they drive a locally built container and name host paths, so they will not run anywhere else unmodified.
- Measurement script — prompt fitting, the streaming request, the timing window and the verdict
- Concourse pipeline — pinned build, weight preparation, RAM preflight, GPU lock, S3 egress
- Raw results — every number in the table above, as the harness wrote it
- Figure source
The authoritative run is Concourse build 2532550 (strata-smoke/smoke/8);
fly -t lab watch -b 2532550 replays its log. Pipeline and specification live
in gavmor/comfyui-workflows at concourse/strata-smoke-pipeline.yml and
docs/experiments/strata-smoke-test.md. The egressed archive
strata-smoke-20261005T061825Z-6f32ec0.tar.gz holds results.json and both
engine logs.