The best tool-error rate in the run belongs to the two models that finished nothing
Status: complete, N=3 tasks per arm. Four tool-capable local Ollama models
drive the pi coding agent through the same three-task battery: flint
passes 3/3 against the incumbent baseline's 0/3, and the metric pre-registered
to break ties ranks the arms backwards.
The question
A coding agent running on a local model is only as good as the model's ability
to actually emit tool calls. The lab points pi at
qwen3-coder-ud-q4kxl:latest by default. flint:latest — 39.8B, NVFP4,
advertising both tools and thinking — is newer and larger, and switching
the default is a decision somebody has to make.
So the question is narrow and answerable: does flint complete more coding
tasks than the model pi already points at? Because a decision rides on the
answer, this is a matched comparison with a named baseline and a
pre-registered decision rule, not an eyeball test.
Method
Four arms, one axis. The only thing that varies between arms is the Ollama model; everything else is pinned.
| arm | Ollama model | role |
|---|---|---|
flint |
flint:latest (39.8B, NVFP4) |
subject |
qwen3-coder-q4kxl |
qwen3-coder-ud-q4kxl:latest (30.5B, Q4_K_M) |
baseline — the incumbent |
qwen3-coder-q5kxl |
Qwen3-Coder-30B-A3B-Instruct UD-Q5_K_XL (30.5B, Q5_K_M) |
contender — heavier quant of the baseline |
nemotron-lightning |
NVIDIA-Nemotron-3.5-Lightning-30B-A3B Q4_K_S (32.9B) |
contender — different vendor |
Every model is checked with ollama show for the tools capability before
inclusion. An agent backend that cannot tool-call is disqualified rather than
scored badly.
Decoding is held constant by construction, not by assertion. pi exposes
no temperature or seed flag, and each base model ships its own Modelfile
defaults — so running the four as shipped would vary decoding along with the
model, which is precisely the axis this design claims to hold. Each arm is
therefore materialised as a derived tag bakeoff-<arm> carrying identical
parameters (temperature 0, top_p 1.0, top_k 1, seed 42, num_ctx 16384,
repeat_penalty 1.1), and the harness reads those values back off /api/show
and fails the arm if any did not stick. A silently-ignored parameter would
confound the comparison invisibly.
num_ctx is pinned at 16384 for every arm including flint, whose 262k
window is deliberately unused: a bigger context window is a different
advantage from driving an agent well. pi runs at a pinned 0.73.1 with
skills, extensions, context-file discovery, prompt templates and themes all
disabled, each arm under its own HOME, so no machine-local state rides
along. Arms run serially under a GPU lock, one model resident at a time on the
single 3090.
The battery, and why no arm is scored on its prose
Three self-contained tasks, each with an objective oracle whose exit status is the verdict:
| task | kind | oracle |
|---|---|---|
t1-bugfix |
fix a bug under existing tests | stdlib unittest passes and the test file is byte-identical to the fixture |
t2-multifile |
coordinated rename across three files | a held-out check imports the new names, asserts no stale references remain anywhere, and runs the entry point |
t3-toolheavy |
many small tool calls, exact structured output | a held-out check recomputes the truth from the CSV, deletes report.json, and re-runs the agent's script to prove the script produced it |
The held-out checks are copied in at verification time and are never visible to the agent, so a task cannot be passed by editing its own grader. Every arm gets a fresh copy of every fixture, so no arm sees another's edits.
The oracles are themselves tested. Each is run three ways: against the pristine fixture (must fail), against a reference solution (must pass), and against a cheat — rewriting the tests instead of fixing the bug, renaming only the definition and leaving call sites stale, hand-writing the answer JSON with no working script (must fail). All 9 checks behave:
t1-bugfix / unsolved    expect=FAIL got=FAIL ok
t1-bugfix / solved      expect=PASS got=PASS ok
t1-bugfix / cheated     expect=FAIL got=FAIL ok
...
9/9 oracle checks behaved correctly
The null is 0/3. An arm that does nothing to the fixtures scores zero,
measured on these same three oracles in this same configuration — that is the
unsolved row above, and it is not borrowed from another run. An oracle suite
that scored the cheats as successes would produce confident, wrong numbers for
every arm at once.
The decision rule, stated before the numbers
Pre-registered in protocol.yml, committed before the first run:
The hypothesis is SUPPORTED only if flint's completion_rate is strictly greater than the baseline's. Equal completion rates are a NULL result for the hypothesis regardless of how the efficiency metrics fall; in that case the recommendation is decided on tool_error_rate first and wall clock second, and the write-up must say the primary metric did not separate them.
The indeterminate branch is explicit: a tie on completion rate is a null for the hypothesis, and no efficiency metric may quietly promote the subject out of it.
Primary metric: completion rate, oracle passes out of 3. Secondary: tool calls
per task, tool error rate (tool_execution_end events flagged isError over
all calls), turns, and wall clock.
Results
| arm | passed | tool calls / task | malformed calls | tool error rate |
|---|---|---|---|---|
flint (subject) |
3/3 | 6.3 | 3 of 19 | 16% |
nemotron-lightning |
3/3 | 9.3 | 3 of 28 | 11% |
qwen3-coder-q5kxl |
1/3 | 3.3 | 0 of 10 | 0% |
qwen3-coder-q4kxl (baseline) |
0/3 | 2.3 | 0 of 7 | 0% |
| null — untouched fixtures | 0/3 | 0 | 0 | — |
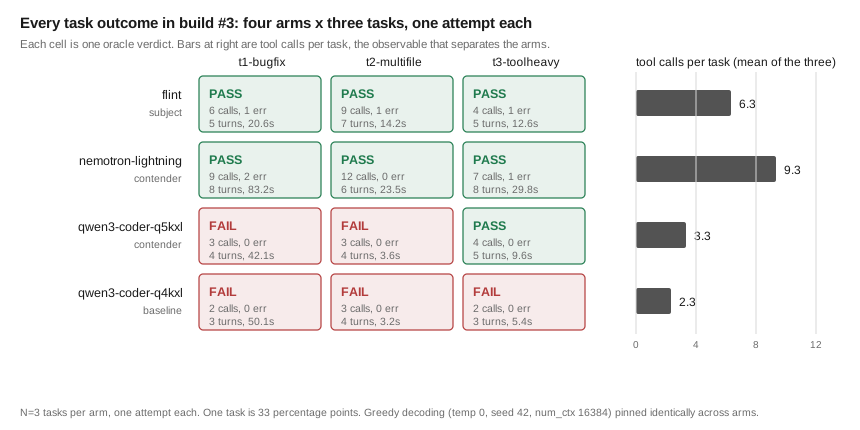
On the pre-registered rule the hypothesis is supported: flint at 100%
is strictly greater than the baseline at 0% on the primary metric.
That headline is the least interesting thing in the run.
What the losing arms are actually doing
They do not fail the tasks. They abandon them. Both Qwen3-Coder arms fail
the same way on every task they fail: they emit prose promising the next
action and then end the turn with no tool call, which terminates the agent
loop. On t3-toolheavy the baseline writes a correct summarize.py and stops
at "Let me run the summarize.py script to generate the report.json file:" —
one call short of passing. On t1-bugfix the q5kxl arm diagnoses the
off-by-one correctly in prose, then stops at "Let me run the tests first to
confirm the failures:".
This is not a competence failure. It is a tool-call emission failure, and it is invisible to the metric meant to catch it.
The tool error rate is anti-correlated with success here. The two arms
that complete almost nothing score a perfect 0%, the best rates in the run,
because a call that is never made can never be malformed. flint sweeps the
battery with the worst rate on the board, 16%.
The rate is worse than useless at the one job it was pre-registered to do.
Its job is the tiebreak between arms with equal completion rates, which here
means flint versus nemotron-lightning at 3/3 apiece — and those two arms
emit exactly the same number of malformed calls, three each over the
three-task battery. The rates differ, 16% against 11%, only because nemotron
makes 28 total calls to flint's 19. The criterion ranks the denominator. It
measures verbosity and reports it as correctness. The rule stands as
pre-registered for this run, with the evidence against it recorded beside it;
replacing it is a deliberate change to make before the next run, not a
correction folded into this one.
The observable that does separate the arms is tool calls per task: 6.3 and 9.3 for the arms that finish, 2.3 and 3.3 for the arms that quit. It is computed from the transcripts, not eyeballed.
A direct "premature abandonment" counter — turns ending in prose with no tool call — is implemented and replayed against these same transcripts. It fires once per run for every arm, including the arms that pass everything, because it counts the agent's normal closing summary. It is not shipped. A metric that cannot distinguish "gave up" from "finished and said so" is worse than no metric, because it looks like one.
What this does not settle
flintversusnemotron-lightningis a tie, not a win. Both sweep 3/3. N=3 cannot separate them, and nemotron does it with 50% more tool calls per task and nearly three times the wall clock. The pre-registered rule speaks only to subject-versus-baseline; choosing between these two needs a bigger battery, not a closer reading of this one.- N=3 tasks, one attempt each. One task is 33 percentage points. 3/3 against 1/3 is a reason to look harder, not a measured ranking. Greedy decoding reduces run-to-run variance; it does not turn N=3 into a confidence interval.
- Nothing about long context.
num_ctxis pinned at 16384 for every arm and the tasks are small. This says nothing about flint's 262k window. - Nothing about whether the abandonment is fixable. The Qwen3-Coder arms
may be recoverable with a different system prompt, a tool-call grammar, or a
newer build. This measures them as
pi0.73.1 drives them, out of the box. - Three tasks are not a coding benchmark. They are a tool-call liveness test with objective graders. An arm that passes all three has demonstrated that it can drive an agent loop, not that it is a good programmer.
Cost
- Compute against output. Build #3 runs 6m23s wall for all twelve task attempts, of which 4m58s is agent time: 47.4s for flint, 58.7s for the q4kxl baseline, 55.3s for q5kxl, 136.5s for nemotron-lightning. The longest single task attempt is 83.2s against a 1200s per-task timeout — nothing comes within an order of magnitude of the budget. A full four-arm matched comparison of local agent backends is a coffee break, not an overnight run.
- Peak memory against capacity. The arms are 16.5, 20.2, 21.3 and 21.6 GiB of weights against a 24 GiB 3090 — 69% to 90% of the card before the 16384-token KV cache, which is why the models run serially under a lock rather than side by side. No per-arm VRAM high-water mark is instrumented; the weight footprint is what is measured here, and the ceiling it implies is the reason the design pins one model resident at a time.
- Calendar time from the ask: about ninety minutes, from the original request at 08:18 to this post. Active build span is 13 minutes across three builds, 08:44 to 08:58.
- Failed and wasted builds. Build #1 goes red in 12s: the merge-commit
guard catches the job running against
main's merge commit rather than the authoring commit. Working as designed. Build #2 goes green in 2m25s having run one of four arms, missing its own baseline.piinherits stdin inside the shell'swhile readloop over the arm list and consumes the other three lines. A one-arm "matched comparison" reports as success, and its rendered summary card should be disregarded. The root cause is fixed by reading the arm list on a dedicated file descriptor, and two independent guards now stand behind it: the harness fails unless every declared arm produced a metrics file, and the comparison step refuses to render from a partial arm set. A green build that silently dropped three quarters of its design is the failure mode worth engineering against.
Files
- Figure source:
plot_bakeoff.py— stdlib only, every plotted number transcribed from the build log - Pre-registration:
protocol.yml(prompt hashsha256:a33099f0…, committed before the first run) - Arm specifications:
flint.api.json,qwen3-coder-q4kxl.api.json,qwen3-coder-q5kxl.api.json,nemotron-lightning.api.json— these are not ComfyUI graphs. Each file is an arm spec: Ollama model id, derived tag, decoding parameters. The.api.jsonextension is what the shared arm-listing tool requires, and every file opens with a note saying so. - Harness, battery, oracles and write-up: branch
feature/exp-pi-ollama-bakeoffingavmor/comfyui-workflows(186f155,0592a06,d0c8ed1) - Raw evidence: per-arm metrics JSON, every
pievent transcript, the oracle logs and a copy of the protocol, ats3://blades68-3d/pi-ollama-bakeoff/. The rendered summary card is in the Immich album "Experiment: pi-ollama-bakeoff". - Build:
exp-pi-ollama-bakeoff/render-pi-ollama-bakeoffbuild 3 on targetlab, 6m23s,pi0.73.1